A lot of web based framework from both open source and branded vendors are frequently used in black box fashion for developing web applications. Everything worked perfectly during testing, however in production it intermittently crashed with out of memory error. Most developers would just add "-Xms2048m -Xmx2048m -XX:PermSize=256m -XX:MaxPermSize=256m" and the problem went away until the next crash. Once daily crashes started to occur often enough, the next typical ingenious solution is to restart the web application every day using a scheduler. Sometimes even twice in a day.
There is a better way. It involves looking at memory and thread dump to see what was actually going on under the hood and fix the problem! The steps involved are actually quite simple.
1. Look for java process id.
jps -l
2. Do a thread dump.
jstack [java process id] > process_thread.dump
3. Do a memory dump.
jmap -dump:file=process_memory.hprof [java process id]
4. Download MAT from https://eclipse.org/mat/. Run it and open process_memory.hprof with it.
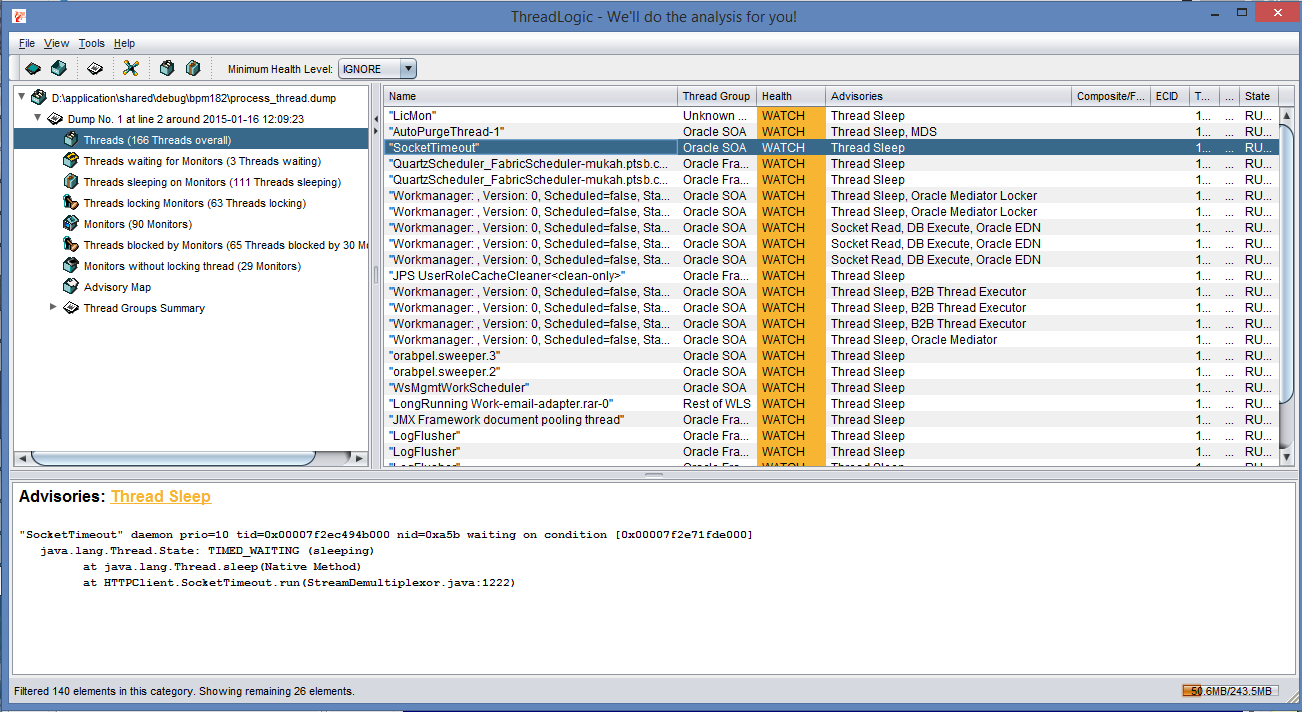
5. Download ThreadLogic from https://java.net/projects/threadlogic. Make sure to compile from the source as the downloaded ThreadLogic-2.0.215.jar from the site does not seem to work. Run it and open process_thread.dump with it.
These tools help tremendously in hunting down the root cause of the dreaded "out of memory" problem at production environment. Best part is that no changes need to be make to the running application. For weblogic server, the Oracle advisory map that comes with ThreadLogic is invaluable as it can quickly be used to zoom in on the potential problem area.
Reference:
jmap - http://docs.oracle.com/javase/7/docs/technotes/tools/share/jmap.html
jstack - http://docs.oracle.com/javase/8/docs/technotes/tools/unix/jstack.html

It's Really A Great Post. Looking For Some More Stuff.
ReplyDeleteBest Salesforce CRM training institute in Bangalore
Best Oracle DBA Training Institute in Bangalore
Best Oracle SQL Training institute in Bangalore
Best Java Training in Bangalore
HTML stands for Hyper Text Markup Language. HTML is the standard markup language for creating Web pages. HTML describes the structure of a Web page.
ReplyDeleteinternship in chennai for mechanical
internship in chennai for cse students
internship in chennai for eee
internship in chennai for ece students
internship in chennai for bcom students
internship in chennai for mechanical engineering students
python internship in chennai
internship in chennai for it students
companies offering internship in chennai
internship in chennai for it
Android training helps learners understand mobile application development using the Android platform. It focuses on building functional mobile apps with practical coding techniques. This android training improves programming knowledge and development skills. Students learn app design, user interface creation, and backend integration. Real-time exercises strengthen coding confidence. Projects help learners understand real-world mobile development. Structured modules simplify complex Android concepts. It prepares learners for mobile development careers.
ReplyDeleteThis comment has been removed by the author.
ReplyDeleteGreat perspective! data modeling training courses
ReplyDeletemakes complex data relationships easier to understand and manage.